.png)
Zorea Capital Equity 1Q 2026 letter
- Apr 15
- 15 min read
Fellow investors,
Our performance for the first quarter of 2026 was -4.1% (gross) and -4.5 % (net). Net performance is calculated using our standard fee schedule ‘M’ which charges the highest management fee from our different alternatives but no performance fee. As long-term investors, we emphasize that evaluating our results over a short period of time is not informative.

In the first three months of 2026, most large equity indices around the world sold off, which is not unusual. Our performance in the quarter was not driven by a deterioration in the underlying businesses we own. Quite the contrary. In aggregate, our companies reported strong results during the quarter, and long-term fundamentals were broadly stable. The primary driver of returns was a general softening in global equity markets due to geopolitical issues, following a period of strong performance.
While market movements haven’t been extreme, these are the types of markets we like as long-term investors. Large US indices remain elevated, but under the hood there is significant dispersion, with certain areas experiencing meaningful drawdowns.
We believe our portfolio is conservatively allocated and that we have plenty of room to deploy capital should we see more material dislocations. If we do our job well, our long-term returns should benefit from periods of volatility and market drawdowns. Not to say that our portfolio is immune to drawdowns – we fully expect to participate in them – but rather that we (and our companies) use them to our advantage and expect to come out on the other side with a better portfolio[1]. You should know that we are most energized when there is stress in the market (even if our performance looks worse relative to normal periods) and are comparatively uneasy when everything looks rosy.
On that note, we had a busy quarter at Zorea. Over the last three months we initiated two new investments (Topicus.com and MercadoLibre) and completed selling out of two investments (Credit Acceptance and Dollar General). This is uncharacteristically high activity for us. The elevated activity was driven by the opportunity to acquire two world-class businesses, with long runways, and strong management teams, at attractive prices.
In the last seven months, we added three new investments, which together represent 15.2% of the portfolio. These are companies with strong, defensible positions, attractive economics, and long growth runways. These new companies grew revenue per share between 19% and 39% in 2025. We believe they can sustain high growth rates for many years. Earnings should follow suit, though two of the three continue to invest heavily, which obscures their real profitability. The companies we sold to fund these investments are in a worse competitive position and are having a more difficult time growing profitably. Despite this, the look-through P/E of our portfolio is 14.0x as of quarter-end, compared to 14.1x a year ago.
We believe we can continue ‘upgrading’ the portfolio in the current market environment.
Avoiding biases
As the great late Charlie Munger said “if you make a public disclosure of your conclusion, you’re pounding it into your own head.” Writing these letters exposes us to anchoring bias, escalation of commitment bias, and confirmation bias. Please note that no investment operation has had a perfect success rate. We will not be the first. Accordingly, we reserve the right to change our minds and hope to do so quickly and swiftly when appropriate. We take on no obligation to communicate changes of opinion.
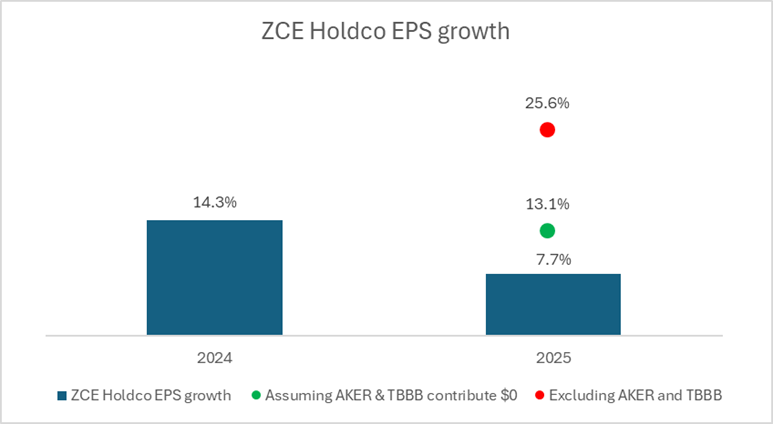
ZCE Holdco EPS growth
In our 1Q 2025 letter, we introduced a metric that calculates the ‘look-through’ growth of our portfolio called ZCE Holdco EPS growth. The metric aims to track how, if our portfolio were a holding company with subsidiaries, its earnings would grow over time. Over many years, earnings growth is the best indicator of share price performance. Provided we don’t pay high valuations for our securities, our long-term gross performance should be at least as good as our ZCE Holdco EPS growth.
There are a number of assumptions that go into calculating this number, which makes it imprecise. We try to lean toward conservatism when making these assumptions. We think of the below numbers as not exactly precise, but approximately correct.
As our readers are aware, in 2025 we initiated investments in AKER BP (“AKER”) and BBB Foods (“TBBB”). As mentioned in previous letters, both companies are investing aggressively in growth, which makes their earnings look negative in the short-term[2]. This is consistent with our expectations. Their negative earnings have the effect of depressing our 2025 ZCE Holdco EPS growth metric.
As a result, we calculated the headline number in the standard way, but also provide adjusted figures, which we believe better reflect underlying earnings power:
Headline 2025 ZCE Holdco EPS growth was 7.7%.
If we assume AKER and TBBB contributed $0 of earnings (as opposed to negative earnings), our 2025 ZCE Holdco EPS growth would have been 13.1%.
If we completely exclude AKER and TBBB from the calculation, our 2025 ZCE Holdco EPS growth would have been 25.6%.
We believe the true growth in earnings power for 2025 lies somewhere between 13.1% and 25.6%.
We provide these adjustments to help contextualize this year’s numbers. Furthermore, over the long-term, the adjustments are just a timing peculiarity. As AKER and TBBB transition from negative to positive contributors, we should see an acceleration in headline growth beyond earnings power growth.
We will always trade short-term earnings noise for long-term earnings power, which may make this number noisy from time to time, but (we expect) should lead to better long-term outcomes.
Last year we said:
“Although Zorea’s number for 2024 was quite competitive, as your manager, we are dissatisfied by it. We aspire for that number to be higher over the long-term. Of course, without sacrificing on company quality, defensibility, and valuation. We have our work cut out ahead of us.”
If we assume earnings power grew in the mid-to-high teens in 2025 – which is below the midpoint of our adjusted range – we trended in the right direction, albeit in a favorable environment. We think there is further room for improvement.
Betting on AI
One of the questions we most often receive is some version of “How are you investing in AI?”
Humans have been inventing new technologies in a capitalistic system for a long time, which gives us useful historical context. Investing in new technology has historically been a difficult proposition. As Alasdair Nairn documents in Engines That Move Markets, nearly every major technological wave – railroads, electrification, autos, aviation, telecom, the internet – followed a similar pattern: a compelling narrative of transformative change attracts abundant capital, which in turn accelerates capacity buildouts well beyond rational demand. Technology adoption grows rapidly, but returns often remain depressed or negative for extended periods. Early investors tend to anchor on the inevitability of the technology and underestimate the competitive nuances.
Throughout history, the value created by new technology for society is immense, but the value captured by equity holders in the early phases is often unspectacular.
Success in new technologies invites competition. Nairn’s case studies show that industries at the edge of innovation typically experience falling prices, excess capacity, and repeated recapitalizations before a stable profit pool emerges. By the time the economics improve, the original capital base has often been impaired, and leadership has shifted. The eventual winners are often not the pioneers. The empirical evidence shows that betting on new technology is a risky proposition.
It is unclear whether AI will follow this historical pattern. However, current dynamics do not give us confidence that it will be materially different.

The pace of competitive change in AI is remarkable. Only a few months ago, many ‘experts’ viewed Anthropic as being out of the race. Today, against all perceived odds, they have the leading models. They have surpassed none other than mighty Google, which is not going to sit idly by as number two.
As long-term investors, directly investing in AI strikes us as a difficult way to make a living. To be clear, we expect some of our companies to benefit from AI, some even materially. We are simply not relying on it in our underwriting.
New investment: Topicus.com (“TOI”)
In the first quarter of 2026 we initiated an investment in TOI. We recently published a memo on that investment. The memo can be accessed by clicking on the link below.
New investment: MercadoLibre (“MELI”)
This quarter, we also initiated an investment in MELI. We believe shares in MELI represent an attractive risk-reward at current prices, given their long runway and ecommerce position in Brazil, Mexico, and Argentina. With that said, there are risks that prevent us from making this a core investment. We have sized the investment accordingly. Below is an abbreviated write-up on the company.
MELI is the leading online commerce and fintech ecosystem in Latin America, operating its ecommerce marketplace across 18 countries and its fintech platform, Mercado Pago, across 8 countries. We see mass ecommerce as a network business supported by logistics. Scale is the name of the game, where market share converges to the largest operators. MELI’s marketplace has the densest network of buyers and sellers in Brazil and Argentina, and is effectively tied with Amazon in Mexico. Its logistics infrastructure is also best-in-class in most of its markets. MELI is deeply embedded in its customers’ daily lives (albeit to different degrees depending on the geography) and is often the default platform consumers turn to for their ecommerce needs.
The company has also leveraged its ecommerce position to build a market leading fintech business. Starting with Mercado Pago, the company’s payment rails, out of necessity. Its fintech operation has evolved from a payments facilitator into a comprehensive financial services platform offering payments, credit, savings, insurance, and other products. Strong execution, combined with a large addressable market, has allowed MELI to compound at a high rate for a long time. The company has now delivered 28 consecutive quarters of 30%+ year over year revenue growth. We believe the runway for growth remains long and the opportunity to continue consolidating share is still significant.
Ecommerce penetration in Latin America remains relatively low compared to other regions, but is growing quickly.

We estimate Mexico’s ecommerce penetration at approximately 18% today versus 9% in 2020. Brazil and Argentina, currently in the 10% to 15% range, have seen similar growth rates. As value propositions improve and consumers become more habituated to ordering online, we see no reason why these markets should not continue converging toward more developed ecommerce economies.
As mentioned, we believe ecommerce is driven by network effects and logistics scale. On the demand side[3], incremental buyers attract incremental sellers, expanding selection, pricing, and improving conversion. This creates a self-reinforcing flywheel as more customers default to the platform with the best selection and lowest prices. On logistics, as order density increases, fulfillment and last-mile costs decline on a per-unit basis, delivery speeds improve, and service levels rise. For example, in Brazil, MELI might have a street where it delivers 100 daily packages, whereas Amazon might only deliver 30 packages. These two loops (marketplace and logistics) reinforce one another. The end state is a structurally advantaged platform or two, where both customer acquisition and order fulfillment are meaningfully lower cost than at any subscale competitor.
While market share data across the region is imperfect, we estimate MELI’s share at roughly 30% in Brazil (versus Amazon at ~20% and Shopee at ~15%), approximately 38% in Mexico (versus Amazon at ~40%), and over 60% in Argentina.
On the fintech side, the runway is arguably even longer, and competition less intense. In simple terms, we think of this business as having two main operations: payments and lending. These are two categories that have been significantly underserved in most of Latin America.
MELI’s position in ecommerce has given it a unique position from which to build the fintech operation. At Zorea, we have experience evaluating the synergies between retailing and financial services. We are shareholders of Synchrony Financial (“SYF”) – North America’s largest retail credit card issuer – and have been involved with that industry for 10 years. Retailers, such as MELI, tend to have some of the lowest customer acquisition costs for certain financial products. This is a dynamic that has existed for over a century. That is why SYF has some of the lowest operating costs of any bank, and part of why MELI has good underlying economics in that business. Online retailers also have a close connection to payments, with some notable payment platforms having come out of retailers. Examples include PayPal, Alipay, Shopify Payments, Mercado Pago, among others.
MELI is successfully targeting their imbedded customer base to grow the fintech business. This business has grown from $950mm in revenue and $189mm in receivables in 2019 to $12.6bn in revenue and $9.4bn in receivables in 2025. While this growth is impressive, rapid expansion in a credit business introduces risk, which is one of the reasons we have sized the investment more conservatively. That said, we take comfort in (1) management’s relatively conservative posture toward lending, (2) meaningful loan loss provisioning, and (3) their Balance Sheet capacity to absorb credit losses without impacting the rest of the company.
The other risk we are monitoring is competition in Brazil. Shopee entered the market in 2019 with an aggressive strategy built on heavy subsidies, a gamified user experience, and a long-tail seller base. The strategy gained traction, particularly at the low end of the market, and is now attempting to move upmarket. As we write this, the company continues to invest aggressively across its Brazilian operation, which has allowed it to gain 15% of the market. While this strategy has driven share gains, it has come at significant cost, and the business remains far from profitability.
In 2025, MELI lowered the free shipping threshold in Brazil and introduced additional network benefits, which have weighed on margins in the near-term (as demand backfills). These actions may have been partly defensive in response to Shopee, but are also consistent with MELI’s long-standing approach of reinvesting to enhance marketplace utility. We suspect it is a combination of both. Shopee is not letting MELI become complacent. That said, we believe Brazil is MELI’s to lose. The company retains the upper hand across most scenarios, driven by superior logistics, deeper network density, and its position as the preferred platform for mid-to-higher-quality goods. Importantly, MELI continues to invest behind its value proposition rather than cede ground. Shopee’s strategy of entering at the low end and moving upmarket is difficult to execute, as brand perception is hard to change; in Brazil, Shopee is still widely viewed as the platform for low-cost Asian imports.
Regardless, mass ecommerce is generally not a winner-take-all market. Brazil can sustain two profitable competitors. If there are two long-term winners, we believe MELI is highly likely to be one of them.
Lastly, a MELI write-up would not be complete without touching on management. Marcos Galperin founded the company in 1999 and led it as CEO for 26 years. Through a long-term mindset and world-class execution, Galperin and his team built MELI from nothing, into Latin America’s dominant ecommerce and fintech platform. Galperin stepped down as CEO at the end of 2025 and remains actively involved as Executive Chairman. Ariel Szarfsztejn, the new CEO, joined MELI in 2017 and rose quickly through the ranks by demonstrating a strong ability to execute. He strikes us as a highly motivated operator with a proven ability to deliver at a high level.
Galperin would attribute MELI’s success to its culture. The company is built on meritocracy, an entrepreneurial mindset, high standards, and long-term thinking. The organization emphasizes speed, disciplined risk-taking, and continuous iteration. Our research suggests that MELI is the employer of choice in Latin America – where motivated, well-educated talent aspires to work.
MELI shares declined approximately 32% from peak to our purchase price, primarily due to concerns around (1) increased competition in Brazil, and (2) AI related fears. We have addressed competition in Brazil above. As it relates to AI, we do not believe the technology poses a material threat to MELI’s core business. AI cannot replicate physical logistics and fintech. AI is unlikely to take material traffic away from the large ecommerce platforms. While it may impact how users discover products, we do not see it disintermediating large ecommerce platforms in a meaningful way. OpenAI seems to share our view, as it recently scrapped its initiative to sell directly on its platform. They realized that being a place where people search is not the same as being a retailer.
We acquired shares at approximately 30x 2026 earnings. However, this multiple understates earnings power given the large amount of growth investments going through the Income Statement. Conservatively adjusting some of these growth investments, we estimate the underlying 2026 P/E to be closer to 21x. We see this as a bargain for a business that can redeploy capital at high rates of return, can grow at a fast rate with a long runway, and is managed by a highly motivated team with the best track record in Latin America.
Alignment
A cornerstone of our portfolio management philosophy is to manage client portfolios in the same way we invest our own capital. At Zorea, we cannot guarantee results, but we can guarantee that we are in the same boat as our investors.
Thank you for your trust.
Yours truly,
Simon Bennaim
Footnotes
[1] In aggregate, we expect our companies to gain market share in a downturn. We also expect to be able to make particularly accretive allocation decisions in such periods. Of course, the future is uncertain, and there is always risk.
[2] See our 4Q 2025 letter for more details.
[3] The demand side is the truly important side in mass ecommerce, as sellers will always chase demand.
Disclaimer and disclosures
The information in this presentation was prepared by Zorea Capital LP (“Zorea”). It has been obtained from public sources believed to be reliable. Zorea makes no representation as to the accuracy or completeness of such information. Opinions, estimates, and projections in this presentation constitute the current judgment of Zorea and are subject to change without notice.
Any investment in any strategy, including the strategy described herein, involves a high degree of risk. The description of the approach of Zorea Capital LP (“Zorea”) and the targeted characteristics of our strategies and investments is based on current expectations and opinions and should not be considered definitive or a guarantee that the approaches, strategies, and your investment portfolio will, in fact, possess these characteristics. In addition, the description of our risk management strategies is based on current expectations and should not be considered definitive or a guarantee that such strategies will reduce all risk. These descriptions are based on information available as of the date of preparation of this presentation, and the description may change over time. Past performance of any strategy we employ is not necessarily indicative of future results. There is the possibility of loss, including loss of principal.
Any projections, forecasts, or estimates contained in this presentation are necessarily speculative in nature and are based upon certain assumptions. It can be expected that some or all of such assumptions will not materialize or will vary significantly from actual results. Accordingly, any projections are only estimates and actual results will differ and may vary substantially from the projections or estimates shown. This presentation is not intended as a recommendation to purchase or sell any commodity or security.
Performance information in this document reflects the actual performance of the account established by Zorea’s Chief Investment Officer as of May 1, 2024. Reported net performance is net of all actual trading and other account expenses, reinvestment of all income, as well as Zorea’s fees. Zorea’s fees, as presented here, are composed of our standard fee schedule for non-Qualified Clients, consisting of a 1.8% management fee. Our Qualified Clients may elect from other fee schedules we offer. Qualified Clients who elect a different fee schedule may pay higher (or lower) fees and therefore realize lower (or higher) net returns depending on the portfolio’s performance. The specific fee charged to a client will be identified in the client’s advisory agreement.
Because this account was established prior to Zorea becoming a registered investment advisor, this means the performance results are ‘hypothetical’. Different types of investments involve varying degrees of risk and there can be no assurance that any specific investment will either be suitable or profitable for a client’s investment portfolio.
Index information is included for illustrative purposes only, as it is not possible to directly invest in an index. Indices are unmanaged, hypothetical vehicles that serve as market indicators. Index performance does not include the deduction of fees or transaction costs which otherwise reduce performance of an actual portfolio.
Broader market events will generally have some corresponding impact on our results and the client portfolios managed in accordance with our strategy. For example, if US equity markets rise overall, that will frequently help the performance of portfolios with exposure to US equities, while declines in the overall US equity markets will frequently hurt the performance of portfolios with exposure to US equities. Similarly, increases or decreases in interest rates will have an inverse relationship on bond market prices (higher interest rates generally result in lower bond prices, and vice versa) and also some corresponding impact on the returns of fixed income investments. No investment approach can guarantee a positive return or prevent loss.
Performance results shown are not a guarantee of future results and are not a guarantee or prediction of how any client portfolio will perform.
The information contained in this presentation is provided for informational purposes only, is not complete, and does not contain certain material information about our strategy, including important disclosures relating to the risks, fees, and expenses. The information in this presentation does not take into account the particular investment objective or financial or other circumstances of any individual investor.
This presentation is strictly confidential and may not be reproduced or redistributed in whole or in part nor may its contents be disclosed to any other person without the express consent of Zorea and/or its managing partner.
Zorea Capital LP is a registered investment adviser domiciled in the state of New Jersey. We may not transact business in states where we are not appropriately registered, excluded, or exempt from registration. Individual responses to persons that involve either the effecting of transactions in securities or the rendering of personalized investment advice for compensation, will not be made without registration or exemption.
Portfolio Metrics – notes on methodology:
For all companies we use latest reportable information as of the date of the quarter. The numbers are our best estimates and what we use internally. However, coming up with the different numbers requires assumptions and some subjectivity. We try to be consistent with our methodology through time but there is no guarantee of accuracy. We use source documents for our calculations. The growth calculations under this table are a weighted average of the underlying growth of our investments. Some important callouts below.
• Revenue per share growth (LTM): only includes our single names (indexes are excluded). For CACC, SYF, and AER, we substitute Revenue growth for Book value growth as we see that metric as more relevant to underlying business growth.
• # of Positions: excludes T-Bills.
• ROE, PE, and EPS growth: all three of these metrics use ‘earnings’ either in the numerator or the denominator. For the companies that we see GAAP or IFRS Net Income as a good proxy of earnings power, we use that. For the companies where it isn’t, we use the metric we deem most appropriate, which is usually Free Cash Flow or company adjusted earnings, but can be something else. We believe we are conservative when publishing these numbers, but we cannot guarantee that such is the case. Both ROE and EPS growth calculations excludes our exposure to indexes and cash. HCA is excluded from our ROE calculation because the company has negative equity. TBBB is excluded from these three metrics as earnings are not meaningful.
• PE (LTM, ex-cash & index): This metric represents out calculation of PE of our individual company investments. It excludes cash as well as any index exposure we may have.